Extract SOQL Queries With Their Execution Counts From Your Debug Log Files
Have you ever been trying to analyze a log file and your mind goes blank? Or maybe you just don’t have any idea on how to analyze your sales data? Whatever the case, this SOQL Extractor and Analyzer for SalesForce might help you extract and analyze SOQL queries with their execution counts from your Salesforce.
Extract SOQL queries with their execution counts from your debug log files with the help of this tool. It is a great tool that helps you extract and analyze SOQL queries. The tool works in two modes: Classic mode and Lightning. For the Classic mode, users need to have a debug log on their Salesforce. But for the Lightning mode, users need to log in to their Salesforce account.
How does the tool work?
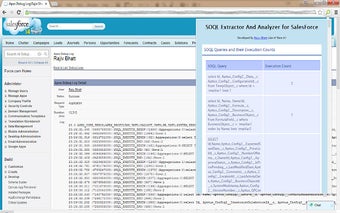
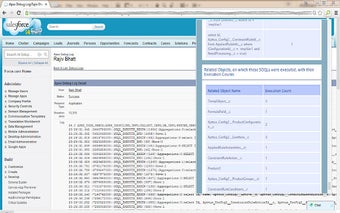
It works on the concept of the debug log. You need to get the debug log for your account on Salesforce. And then you will be able to see a list of queries in the log file. You can click on one of them and it will show you the syntax of that particular query and the number of times it is executed. You will also see the objects on which the queries are executed.
Also, if you have got queries that hit the Account object 5 times, you might want to have a relook at the code and optimize the code in a way that you get all the data from the Account object in a single SOQL query (instead of querying it 5 times).